1. Windowing > Auto
Shortcut: 0
Helps to adjust the window level and width automatically. This tool can be useful to correct a suboptimal window in a series. eg. ADC
Windowing > ADC - Prostate
A custom ADC window (1400 / 1400) is optional via the right mouse button.

2. Link Scrolled Series
Shortcut: K
Synchronizes scrolling across multiple series. Click the Link Scrolled Series icon (🔗) in the top toolbar to toggle between three modes:
-
Auto Link (A) – Links series from the same study automatically based on shared metadata.
-
Manual Link ("M") – Links separate but aligned series manually, useful when sequences are co-registered.
🔍 A small letter ("A", "M", or "d") appears in the viewport to indicate which mode is active.
3. Crosshair Tool
Enables synchronized navigation between multiple series by selecting a point in one image that acts as a locator while referencing other planes. Useful for lesion localization. This tool may appear via the "more" options menu on smaller screens.
4. Measurement Tools
▫️ Line Tool 📏
Shortcut: D
Measure distances in mm, such as lesion size or organ dimensions, by drawing a straight line.
▫️ Ellipse ROI Tool
Shortcut: Shift + E

Draw an elliptical region of interest (ROI) to measure signal intensity values like mean, standard deviation, and area. Commonly used for ADC quantification or signal evaluation in dynamic series. For more details, here
Tip: Press "E" to erase any drawn lines or ROI.
▫️ TIC Tool (Time-Intensity Curve)
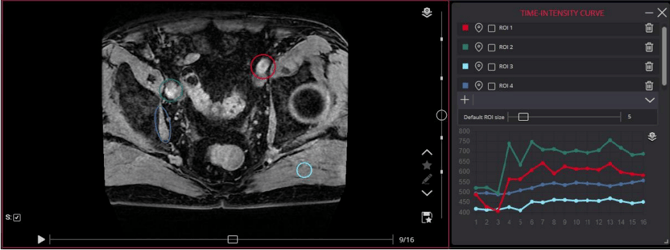
Used in Dynamic Contrast-Enhanced (DCE) MRI to assess enhancement behaviour over time. Place regions of interest to generate a graph showing signal intensity changes during contrast phases.
A full preload of the dynamic series is required for this tool to function. Some dynamic MRI series may display in the viwer as separated series or instead of a large volume series stack of phases.
For more details, see here
5. 4D Tools > Show 4D Slider Bar

Try the 4D Tools > Show 4D Slider Bar function after preloading the study to enable the horizontal 4D slider bar.
- Helpful to navigate between contrast phases and b-values in DWI series.

<----- ▢ ----->
4D Tools > Construct 4D Series
Useful for temporarily merging separated DCE series into a virtual stack of phases.
For studies with multiple DCE phases split across separate series:
- 4D Tools > Construct 4D "virtual" series - this tool may assist in combining split

dynamic phases; requires full preload and matching DICOM metadata series descriptions. The virtual series will appear as the last series in the study.
Note: This feature depends on consistent DICOM metadata and series description across the separated phases and may not function in some studies with suboptimal DICOM metadata.
This tool may appear via the more options menu on smaller screens.
6. Preload Study or Series
To enhance scroll speeds and synchronisation 
-
-
Click the cloud icon beside the study/series in the left panel.
-
Tip: Drag a series description into the viewport to auto-preload.
-
Preloading stores data temporarily in the memory for smoother scrolling and advanced viewer features
-
7. Metadata Consideration 
Advanced tools like linking, crosshair synchronization, and series merging depend on intact DICOM metadata. If images or series are in JPEG format or if metadata has been removed during exportation from PACS, certain viewer tools may not function correctly.